Image of the day

Captured by
Douglas Rollain

M20 Trifid Nebula in LRGBHa

My Account

New to Astromart?

Register an account...

Need Help?

Posts Made By: Dave Snope

November 27, 2009 10:42 PM Forum: Global Warming - REAL or NOT

Primitive Culture Tribalism

Posted By Dave Snope

Your tax money at work, paying the salaries of primitive culture tribes.

Dot Earth: Insights from Mike Hulme at the University of East Anglia, which was the source of the disclosed files. Hulme, a climate scientist at the University of East Anglia and author of “ Why We Disagree About Climate Change,” has weighed in with these thoughts about the significance of the leaked files and emails. In November 2009, Hulme was listed as “the 10th most cited author in the world in the field of climate change, between 1999 and 2009. (ScienceWatch, Nov/Dec 2009, see Table 2).

Hulme Key Excerpt:

[Upcoming UN climate conference in Copenhagen] “is about raw politics, not about the politics of science. [...] It is possible that climate science has become too partisan, too centralized. The tribalism that some of the leaked emails display is something more usually associated with social organization within primitive cultures; it is not attractive when we find it at work inside science. It is also possible that the institutional innovation that has been the I.P.C.C. has run its course. Yes, there will be an AR5 but for what purpose? The I.P.C.C. itself, through its structural tendency to politicize climate change science, has perhaps helped to foster a more authoritarian and exclusive form of knowledge production – just at a time when a globalizing and wired cosmopolitan culture is demanding of science something much more open and inclusive.

http://wattsupwiththat.com/2009/11/27/uea-climate-scientist-possible-that-i-p-c-c-has-run-its-course/#more-13291
November 27, 2009 11:24 PM Forum: Global Warming - REAL or NOT

IPCC Reviewer: There Was Proof of Fraud All Along

Posted By Dave Snope

IPCC expert reviewer Gray — whose 1,898 comments critical of the 2007 report were ignored — recently found that proof of the fraud was public for years.

November 27, 2009 - by Vincent Gray

Nothing about the revelations surprises me. I have maintained email correspondence with most of these scientists for many years, and I know several personally. I long ago realized that they were faking the whole exercise.

When you enter into a debate with any of them, they always stop cold when you ask an awkward question. This applies even when you write to a government department or a member of Parliament. I and many of my friends have grown accustomed to our failure to publish and to lecture, and to the rejection of our comments submitted prior to every IPCC report.

But only recently did I realize that I had evidence of their fraud in my possession almost from the birth of my interest in the subject.

I had copies of these two papers in 1990:

Jones, P. D., P. Ya. Groisman, M. Coughlan, N. Plummer, W. C. Wang & T. R. Karl 1990. Assessment of urbanization effects in time series of surface air temperature over land, Nature 347 169- 172.

Wang, W-C, Z. Zeng, T. R Karl, 1990. Urban Heat Islands in China. Geophys. Res. Lett. 17, 2377-2380.

The first paper has been the major evidence presented by Jones in all of the IPCC reports to dismiss the influence of urban change on the temperature measurements, and also has been used as an excuse for the failure to mention most of the unequivocal evidence that such urban effects exist. The paper was even dragged out again for the 2007 IPCC report.

The second paper, which shared authors Wang and Karl from the first paper, used the very same data from China which the first paper used to demonstrate the absence of urban influence — yet instead concluded that same data to be proof of the existence of urban influence.

In 2007, the following paper exposed the whole business:

D. Holland. Energy and Environment, 18 951-983 “Bias and Concealment in the IPCC Process, the “Hockey Stick” Affair and its Implications.”

The author Holland obtained the original Chinese data and found the claim that the data referred to a continuous series was unfounded. He accused Wang of fraud — and it is interesting to read that Tom Wigley (of the CRU emails) agrees with him.

Wigley fails to say, however, that his colleagues Jones and Karl are guilty of much worse than Wang — as they continued to use their fraudulent paper to boost their constant and sometimes daily assertion that recent global temperatures are unprecedented. It is also interesting now to read the contortions the CRU email clique went through to frustrate the inquiries of Holland.

Wang was cleared of fraud by his university. But what about Jones and Karl?

In 1999, I had a stroke of luck. I asked one of the IPCC officials for the data from which one of their maps was compiled, and I received it. I wrote a paper analyzing the results and submitted it to Geophysical Research Letters. They just sat on it. I instead published it on John Daly’s website. Today, it is still the only paper recognized by Google on “Regional Temperature Change.”

I now know my paper was not critical enough, since we have proof that the basic data and its processing is far more dubious than I had envisaged.

I tried to update my paper and resubmit it. Nothing doing. Since the small group — revealed within the CRU emails — control most of the peer reviewers, very few peer reviewed papers which criticize that group are allowed to appear in the most prominent published literature which dominates the academic establishment.

I have only been able to find a place to release my criticisms on the internet, now the only realm where unfettered scientific discussion is possible.

http://pajamasmedia.com/blog/vincent-gray-on-climategate-there-was-proof-of-fraud-all-along-pjm-exclusive/2/

November 28, 2009 04:43 PM Forum: Global Warming - REAL or NOT

Having a Look at CRU Coefficients

Posted By Dave Snope

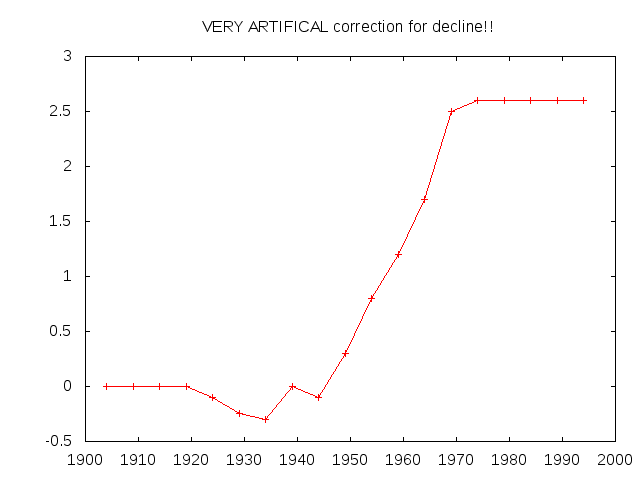
In which renowned software architect Eric S. Raymond takes a look at the CRU programming and finds that the weighting factors look like, well, a hockey stick! What cracks me up is that they actually use the word 'fudge factor' in the code. This shouldn't be a surprise to anyone who has followed this for years -- remember how McIntyre ran 10,000 sets of random data through Mann's algorithm and got 10,000 hockey sticks. No matter to the IPCC though, it was "peer reviewed science".
----------------------------------------

From the CRU code file osborn-tree6/briffa_sep98_d.pro , used to prepare a graph purported to be of Northern Hemisphere temperatures and reconstructions.

;
; Apply a VERY ARTIFICAL correction for decline!!
;
yrloc=[1400,findgen(19)*5.+1904]
valadj=[0.,0.,0.,0.,0.,-0.1,-0.25,-0.3,0.,- 0.1,0.3,0.8,1.2,1.7,2.5,2.6,2.6,$
2.6,2.6,2.6]*0.75 ; fudge factor
if n_elements(yrloc) ne n_elements(valadj) then message,’Oooops!’
;
yearlyadj=interpol(valadj,yrloc,timey)

This, people, is blatant data-cooking, with no pretense otherwise. It flattens a period of warm temperatures in the 1940s 1930s — see those negative coefficients? Then, later on, it applies a positive multiplier so you get a nice dramatic hockey stick at the end of the century.


http://esr.ibiblio.org/?p=1447

November 29, 2009 08:49 PM Forum: Global Warming - REAL or NOT

MWP Deniers Panned for Data Manipulation

Posted By Dave Snope

Rudolph Krupp takes them to task for the ridiculous history of computer simulations that intentionally and fraudulently weight out the Medieval Warming Period that fly in the face of the historical record.

"We must get rid of the Medieval Warm Period"
"We have to get rid of the Medieval Warm Period"


-----------------------------------------------------------------------

Unprecedented warming or unprecedented data manipulation?


Medieval Warm Period thesis contradicts the unprecedented warming

However, one must mention that, on the first half of the statement, which raises the unprecedented warming, with so many a climate scientist and even at many historians significant question marks. And it has not been warmer during this period, in the opinion of many scientists today?

The idea of a medieval warm period in 1965 formulated by the English climatologist Hubert H. Lamb for the first time [1]. Lamb, who founded In 1971, the UK Climate Research Unit (CRU), saw the peak of the warming period from 1000 to 1300, ie in the High Middle Ages. He estimated that temperatures then 1-2 ° C above those of 1931-1960 were Normalperiode. In the far north, it was even up to 4 degrees warmer. The regular voyages of the Vikings from Iceland and Greenland were rarely hindered by ice, and many burial places of the Vikings in Greenland still lie in the permafrost.


Read it here:
http://translate.google.com/translate?hl=de&sl=de&tl=en&u=http%3A%2F%2Fwww.science-skeptical.de%2Fblog%2Fbeispiellose-erwarmung-oder-beispiellose-datenmanipulation%2F001195%2F

fixed the link

November 30, 2009 08:28 PM Forum: Global Warming - REAL or NOT

Celebrity EcoFrauds Wave Green Flags from Jets

Posted By Dave Snope

Check out the picture of Travolta waving a "Going Green" flag from the cockpit of his private jet.

Taking the Private Jet to Copenhagen
http://women.timesonline.co.uk/tol/life_and_style/women/celebrity/article6931572.ece

November 30, 2009 08:39 PM Forum: Global Warming - REAL or NOT

U.N.: Don't Worry About Climate Gate

Posted By Dave Snope

The leaked emails from the University of East Anglia will not affect the UN's advice on global warning, said Rajendra Pachauri, chairman of the UN's climate change body.

"The processes in the IPCC are so robust, so inclusive, that even if an author or two has a particular bias it is completely unlikely that bias will find its way into the IPCC report," he told The Guardian.


http://www.telegraph.co.uk/earth/environment/climatechange/6690110/Leaked-climate-change-emails-wont-bias-UN-global-warning-body-says-chairman.html


The evil of the world is made possible by nothing but the sanction you give it.
Ayn Rand, Atlas Shrugged, 1957

December 1, 2009 12:05 AM Forum: Global Warming - REAL or NOT

White House: Dont Worry About Climategate

Posted By Dave Snope

The Obama White House still believes that non-existent global warming is a reality. While annual temperatures over the last few years are sitting right at the 100-year average, and after the AGW science leadership has been exposed as frauds, they still have the arrogance to tell us to ignore what the thermometers tell us and to listen to them instead.

The White House on Monday made exceptionally clear that it wants nothing to do with the furor over documents that global warming skeptics say prove the phenomenon is not a threat.

Despite the incident, which rocked international headlines last week, climate science is sound, Press Secretary Robert Gibbs stressed this afternoon, and the White House nonetheless believes “climate change is happening.

“I don’t think that’s anything that is, quite frankly, among most people, in dispute anymore,” he said during Monday’s press briefing.


By 'climate change', he means 'warming', right? Even though it has been cooling for ten years. Or does he mean 'any change', which could mean 'cooling', in which case we don't need Cap 'N Tax and Copenhagen's forced Redistribution of Wealth but he wants it anyway. So, is he stupid, or a liar, or a Marxist, or all three?


December 3, 2009 04:10 PM Forum: Global Warming - REAL or NOT

Hiding The 1940s Blip

Posted By Dave Snope

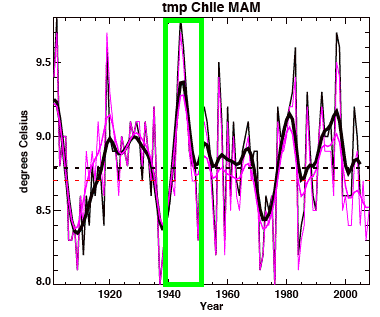
In which Stratasphere takes a look at the CRU raw data and plots it to track down the infamous "blip" that the CRU was trying to get rid of. After all, if it was warmer in 1940 when CO2 was much lower, the AGW theory is blown to bits. Just like it was with the MWP.

This ‘blip’ is easily seen in many of the CRU data runs from 2005 and 2008 which were made public by what some assume is a CRU insider with a conscience. These graphs show the raw ‘land’ blips, prior to data fudging. What Wigley is doing (ironic name, eh?) is making the mean Earth Temp in this period go down by pushing the ocean temps down significantly. This globally makes the current period look much warmer in comparison. Since the ocean represent 75% of the Earth’s surface this fudge factor is quiet weighty.

You can see the infamous blip in this CRU generated graph for Chile, March-April-May (MAM):


This email and these charts got me to wondering how bad the 1940’s blip was, which is why I went and looked at all the graphs and measured the pre-1960’s peak and compared them to the 2000’s peak – to see if there was actually a significant difference.

What I discovered surprised even me. Of all the countries graphed out in the CRU ‘raw’ data, 75% showed a peak-to-peak difference less than 0.5°C – which means they was no significant climate change for three quarters of the world’s land measurements. There are multiple reasons for 0.5° to be a valid test of significance, but two of the most salient reasons are (1) the alarmists’ claim the Earth has experience 0.6° – 0.8°C or greater in the last 100 years and (2) ever since the Little Ice Age the Earth has been warming on average around the 0.5°C per century mark. I won’t even go into the issue of accuracy in the measurement data spanning 100 years.

Of the 25% which did show a temperature change outside this ‘normal’ range 6 countries (or 4%) showed significant cooling – not warming. Only 21% of the countries covered in the ‘pre-corrected’ CRU data showed significant warming. That means 79% of the land did not.


So how do you make charts that look like the CRU charts above look like this:


Remember those coefficients?????

Wigley would seem to be target number 1 for investigating. His emails with plan to fudge + CRU Temp Graphs with blips clear blips + CRU code which adjusts the graphs with blips = one big climategate scandal.

Tom Wigley is an American working at UCAR, which means he will be investigated by Congress since UCAR and The National Science Foundation are up to their shoulders in IPCC and probably CRU.


http://strata-sphere.com/blog/index.php/archives/11685

December 4, 2009 03:42 PM Forum: Global Warming - REAL or NOT

The World’s Future Hangs On “OH F–K THIS”!

Posted By Dave Snope

Mark Steyn adds his typical sharp wit to the issue

Yet perhaps the most important revelation is not the collusion, the bullying, the politicization and the evidence-planting, but the fact that, even if you wanted to do honest “climate research” at the Climatic Research Unit, the data and the models are now so diseased by the above that they’re all but useless. Let Ian “Harry” Harris, who works in “climate scenario development and data manipulation” at the CRU, sum it up. Mr. Harris was attempting to duplicate previous results—i.e., to duplicate all that science that’s supposedly settled, and the questioning of which consigns you to the Climate Branch of the Flat Earth Society. How hard should it be to confirm settled science? After much cyber-gnashing of teeth, Harry throws in the towel:

“ARGH. Just went back to check on synthetic production. Apparently—I have no memory of this at all—we’re not doing observed rain days! It’s all synthetic from 1990 onwards. So I’m going to need conditionals in the update program to handle that. And separate gridding before 1989. And what TF happens to station counts?

“OH F–K THIS. It’s Sunday evening, I’ve worked all weekend, and just when I thought it was done I’m hitting yet another problem that’s based on the hopeless state of our databases. There is no uniform data integrity, it’s just a catalogue of issues that continues to grow as they’re found.”

Thus spake the Settled Scientist: “OH F–K THIS.” And on the basis of “OH F–K THIS” the world’s enlightened progressives will assemble at Copenhagen for the single greatest advance in punitive liberalism ever perpetrated on the developed world.


http://www2.macleans.ca/2009/12/03/the-science-of-global-warming/

December 5, 2009 10:39 PM Forum: Global Warming - REAL or NOT

Raw CRU Data vs. Model plots shows the BS

Posted By Dave Snope

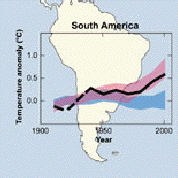
AJStrata does some more plotting to show the plot:
---------------------------------------------------

The reddish band is the AGW model predictions where CO2 feedback is driving Earth’s climate over the last 100 years. Because this reddish band follows the black ‘observations’ line the conclusion would be that the theory of AGW has been supported in the temperature record. The blue band shows what the models PREDICTED the global temperatures would be without AGW. Climategate has really done a number on that black line folks.


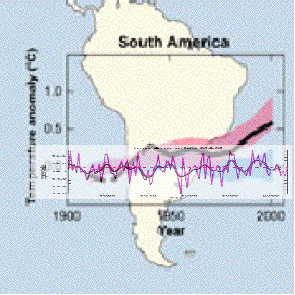
The CRU raw station data I have been looking over does not follow the black ‘observation’ lines, at all. Those researchers tuning their AGW models to the CRU post ‘adjusted’ data have been chasing a ghost.

This is March-April-May for Argentina. It is fairly representative of South America has a whole. Now what happens if I overlay this CRU pre ‘adjustment’ historical temp data on top of the IPCC AGW model predictions – what will this data show?


The CRU raw temp data actually follows the blue band, where the models say the temps will fall if AGW does not exist.


http://strata-sphere.com/blog/index.php/archives/11732#more-11732